 |
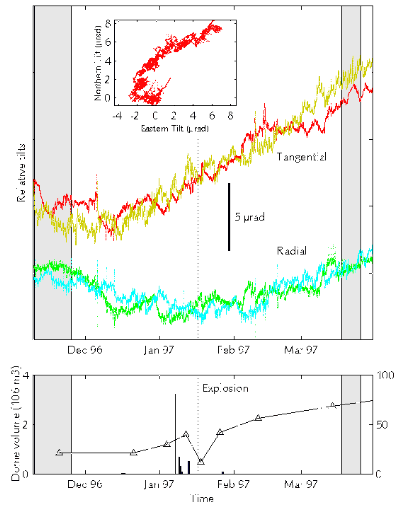
Figure 7. (a) Relative tilt signals at Deles between the 2 GPS campains (dashed zones): 2 radial and 2 tangential components. Inset plot shows the horizontal projection of the average motion of the tip of the normal to ground surface. (b) Dome volume estimation (solid line and triangles) and number of pyroclastic flows (bars) within the period. Dotted vertical line corresponds to the time of the dome explosion (January 17th, 1997). |